Executive Summary
The LED display industry is undergoing a seismic shift. In Q1 2025, SMD (Surface-Mounted Device) technology’s market share fell to 77.6% (down 2% YoY), while COB (Chip-on-Board) surged to 22.1% 13. 以及 MiP (Multi-in-Package) reached 0.3%This report explores the drivers behind this trend among SMD vs. COB vs. MiP, compares the technologies, and forecasts their future roles.
1. Market Share Analysis: Why SMD Is Losing Ground
1.1 The Decline of SMD
SMD has dominated LED displays for decades due to its mature supply chain 13. 以及 cost efficiency. However, its limitations in micro-pitch displays (below P1.2) are becoming apparent:
Pixel density limits: SMD’s single-pixel packaging struggles with pitches below P1.0.
Higher maintenance costs: Annual upkeep averages 2.3× more than COB.
Production bottlenecks: Achieving finer pitches requires expensive upgrades.
1.2 The Rise of COB and MiP
| Metric | SMD | COB | MiP |
|---|---|---|---|
| 2025 Q1 Share | 77.6% | 22.1% | 0.3% |
| YoY Change | -2% | +2.2% | +0.1% |
| Best Pitch | ≥P1.2 | ≤P1.0 | ≤P0.9 |
COB’s growth drivers:
Simplified production: Integrates chips directly onto PCBs, reducing steps.
Price drops: Average COB product prices fell 31.4% YoY in 2025.
Durability: No exposed wires, reducing failure rates.
MiP’s niche advantages:
Flip-chip design: Enables higher resolution 13. 以及 better thermal management.
Micro LED compatibility: Critical for P0.9 and below applications.
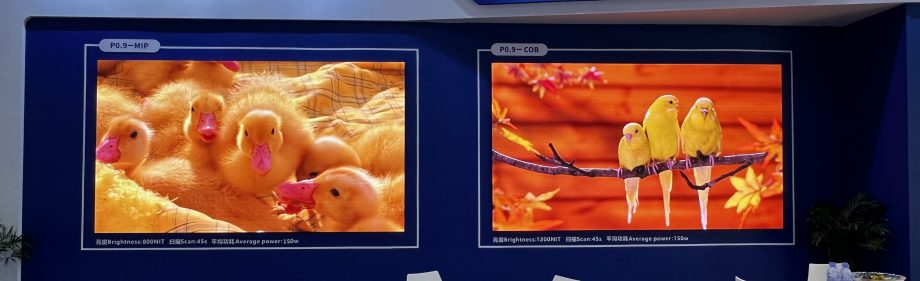
2. Technology Deep Dive: How COB and MiP Outperform SMD
2.1 COB: The Micro-Pitch Leader
Key innovations:
Direct PCB bonding: Eliminates SMD’s lamp bead packaging, reducing dead pixels 13. 以及 ghosting.
Seamless displays: No gaps between pixels, ideal for 4K/8K video walls.
Case study: Leyard’s COB-P0.9 displays now power 30% of Fortune 500 boardrooms.
Limitations:
Color consistency: Challenging in large-screen splicing.
Repairability: Damaged modules often require full replacement.
2.2 MiP: The High-End Disruptor
Why MiP wins in premium markets:
Higher yields: 20% better than traditional Micro LED at P0.6-P0.9 pitches.
“Zero defects”: Eliminates SMD’s caterpillar effect (black-line failures).
XR applications: Used in 90% of Hollywood virtual production stages (e.g., Disney’s Mandolorian).
Adoption barriers:
Cost: Still 3-5× 高昂 比等效间距的SMD更贵。
可扩展性: 需要 10,000+ 尼特 用于户外使用。
3. 成本比较:为什么SMD仍然有其作用
3.1 总拥有成本(TCO)分析
| 成本因素 | SMD | COB | MiP |
|---|---|---|---|
| 初始成本(P1.2) | $800/m² | $1,200/m² | $3,500/m² |
| 5年维护 | $400/m² | $170/m² | $250/m² |
| 能耗 | 300W/m² | 270W/m² | 230W/m² |
SMD的优势区域:
预算项目: 体育场显示屏,户外广告牌。
新兴市场: 非洲/东南亚,其中 价格 > 像素密度.
4. 未来展望:共存或取代?
4.1 混合化趋势
COB+MiP融合: 公司如 NationStar 现在提供 COB-backed MiP 用于 P0.4-P0.6 显示器。
SMD的最后一站: IMD (集成安装设备) 技术在其 P1.5-P2.5 市场中延长其寿命。
4.2 新兴应用
| 技术 | 成长部分 | 2025-2030 年复合年增长率 (CAGR) |
|---|---|---|
| COB | 企业AV (75%) | 18.2% |
| MiP | 电影VR (90%) | 34.5% |
| SMD | 户外广告 (60%) | 5.1% |
4.3 人工智能的未知数
机器学习: 在实时中补偿COB的色彩漂移(例如, Google的DeepColor SDK).
预测性维护: 通过 40% 控制室中减少MiP的停机时间。
结论:一个碎片化的未来
LED显示屏市场将 分层,而不是合并:
SMD: Maintains ~65% share by 2030 in cost-sensitive apps.
COB: Controls 50%+ of P0.7-P1.2 by 2026.
MiP: Dominates P0.4-P0.9 for metaverse/medical imaging.
Recommendations for Buyers:
Choose SMD for: High-brightness outdoor screens (>P2.0).
Opt for COB for: Boardrooms, broadcast (P0.9-P1.5).
Invest in MiP for: Virtual production, surgical displays.
Industry Verdict: “COB and MiP are the future, but SMD won’t retire quietly.”
— Dr. Lisa Chen, MIT DisplayLab
Reference source: The Proportion of Sales Continues to Expand, COB/MiP Is Eroding the SMD Display Application Market