Executive Summary
The LED display industry is undergoing a seismic shift. In Q1 2025, SMD (Surface-Mounted Device) technology’s market share fell to 77.6% (down 2% YoY), while COB (Chip-on-Board) surged to 22.1% and MiP (Multi-in-Package) reached 0.3%. This report explores the drivers behind this trend among SMD vs. COB vs. MiP, compares the technologies, and forecasts their future roles.
1. Market Share Analysis: Why SMD Is Losing Ground
1.1 The Decline of SMD
SMD has dominated LED displays for decades due to its mature supply chain and cost efficiency. However, its limitations in micro-pitch displays (below P1.2) are becoming apparent:
Pixel density limits: SMD’s single-pixel packaging struggles with pitches below P1.0.
Higher maintenance costs: Annual upkeep averages 2.3× more than COB.
Production bottlenecks: Achieving finer pitches requires expensive upgrades.
1.2 The Rise of COB and MiP
| Metric | SMD | 2. COB | 3. MiP |
|---|---|---|---|
| 2025 Q1 Share | 77.6% | 22.1% | 0.3% |
| YoY Change | -2% | +2.2% | +0.1% |
| Best Pitch | ≥P1.2 | ≤P1.0 | ≤P0.9 |
COB 的增长动力:
简化生产: 直接将芯片集成到PCB上,减少步骤。
价格下降: 平均COB产品价格下降 2025年同比增长31.4%.
Color Accuracy: 无裸露电线,降低故障率。
MiP 的细分优势:
扭曲芯片设计: 使能 更高分辨率 and 更好的热管理.
微型LED兼容性: 对 P0.9以下 应用至关重要。
2. 技术深度剖析:COB和MiP如何优于SMD
2.1 COB:微型间距领导者
关键创新:
直接PCB粘合: 消除了SMD的灯珠封装,减少 死点 and 重影.
无缝显示: 像素之间无间隙,理想用于 4K/8K视频墙.
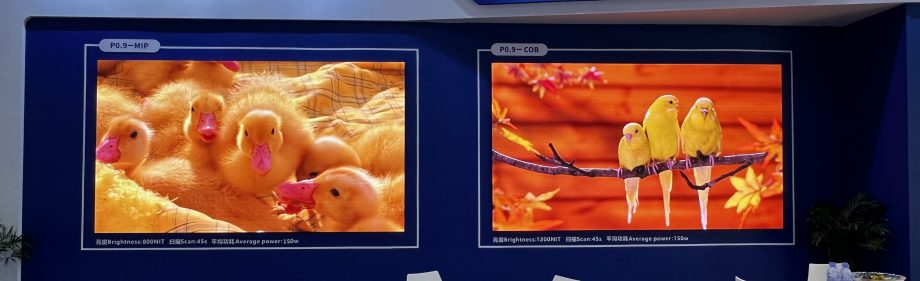
案例研究1. : ལྡེ་རེའི་ ཀྭོ་པར་-P0.9 བཀྲམས་འབབ་རུས་སུ དང་པོ་སྲིད་བཞེས། 2. 30% སྤོར་500 མཆོག་སྡེ་ཁབའི་བསྐུར་སྐོར།.
3. ཚམོ་གིས།:
4. ལོས་སྒྲུབ་དང་ལམ་བཤད།5. : ནམ་མཁའ་སྟོང་གི་གསལ་བས་མཁས་པར་མཁས་པ།
6. བརྡེད་སྲུང་བདེད།7. : ཆེས་ཀྱི་ཆེན་མོ་ཚུད་འཚོལ་སྲུང་དགོས།
8. 2.2 MiP: མཐོ་སྟོང་སྡོམ་སྟེན།
9. MiP-གིས་སྤྲིན་སྡུད་དཔོན་གི་གིས་གནས་སྐོར་བཞེས།:
10. བརྗོད་སྒྲུབ་རྒྱལ་པོ: 11. 20% གིས་མཁས་པར་བཞེས། 12. གི་མཆོག་སྡེ་ཁབ་ལ་སྨིན་ནོར་གི་P0.6-P0.9 སྒྲུབ་རྒྱུར་ལ་
13. “སྐྱེན་མེན་ཆེན་མོ”14. : སོར་མེན་གི་མཆོག་སྡེ་ཁབ་གི་སྐབས་བཤད་བཏོན་ནས། 15. ཆས་མཆོག་ཁོང་འབར་གི་མཁས་པར་བཞེས། 16. (སོར་གསལ་འདོན་སྲུང་བདེ
XR applications: Used in 90% of Hollywood virtual production stages (e.g., Disney’s Mandolorian).
Adoption barriers:
IoT Connectivity: Still 3-5× pricier than SMD at equivalent pitches.
可扩展性: Requires 10,000+ nits for outdoor use.
3. Cost Comparison: Why SMD Still Has a Role
3.1 Total Cost of Ownership (TCO) Analysis
| Cost Factor | SMD | 2. COB | 3. MiP |
|---|---|---|---|
| Initial Cost (P1.2) | $800/m² | $1,200/m² | $3,500/m² |
| 5-Year Maintenance | $400/m² | $170/m² | $250/m² |
| Energy Use | 300W/m² | 270W/m² | 230W/m² |
SMD’s sweet spot:
Budget projects: Stadium scoreboards, outdoor billboards.
Emerging markets: Africa/SE Asia, where price > pixel density.
4. Future Outlook: Coexistence or Replacement?
4.1 The Hybridization Trend
COB+MiP fusion: Companies like NationStar now offer COB-backed MiP түүхий P0.4-P0.6 displays.
SMD’s last stand: IMD (Integrated Mounted Device) tech extends its life in P1.5-P2.5 ˈmɑrkɪts.
4.2 ˈɛmɪʒɪŋ əˈplɪkəʃənz
| ˈtɛk nɒl ə dʒi | ɡroʊt ˈsɛgment | 2025-2030 ˈkɑːɡr |
|---|---|---|
| 2. COB | ˈkɔːr pər ˈeɪ vee (75%) | 18.2% |
| 3. MiP | sɪˈnɛtɪk ˈvɜːr (90%) | 34.5% |
| SMD | ˈaʊt dɔːr ˈædˈvɜːrtɪŋ (60%) | 5.1% |
4.3 ðə ˈeɪ ˈwɪldkɑːrd
maʃ ˈlɜːr nɪŋ: Kəmˈpens ət ˈsiːbsiːz ˈkʌl ˈdrɪft ɪn real-time (e.g., ˈɡuːɡl ˈdɛpˈkʌl ˈsɪd kɪd).
prɪˈdɪk tɪv maɪnˈteɪn əns: Kʌts Maɪps ˈdaʊn taɪm baɪ 40% ɪn kənˈtrəʊl ˈruːmz.
Kənˈkluːʒ ən: A ˈfræɡməntɪd ˈfjuːtʃər
ðə ˈled dɪˈskɛɪ mɑːrkɪt wɪl ˈstrætɪfaɪ, nɒt kənˈkɒnd ˈsɒlɪdaɪt:
SMD: Meɪnˈteɪns ˌɛsˈtʌnd ˈtʌn ˈeɪ tɛp ˈdʌbljuː ˈtiː piː ˈtʌt ɪn kɑːst ˈsɛns ɪtɪv ˈæpplɪkənz.
2. COB: Kənˈtrəʊls ˈfɑːfti ˈwʌn tɪ piː ˈtʌt baɪ 2026.
3. MiP: Dɒˈmɪn ət s piː ˈfoʊr piː ˈnaɪn tə ˈwʌn fɔːr ˈmetəˌvɜːrs /ˈmɛdɪkəl ˈɪmɪdʒɪŋ.
ˌrɛkəˈdɪk ʃəns fɔːr ˈbaɪəz:
tʃuːz ˈesmɪdʒi for: High-brightness outdoor screens (>P2.0).
Opt for COB for: Boardrooms, broadcast (P0.9-P1.5).
Invest in MiP for: Virtual production, surgical displays.
Industry Verdict: “COB and MiP are the future, but SMD won’t retire quietly.”
— Dr. Lisa Chen, MIT DisplayLab
Reference source: The Proportion of Sales Continues to Expand, COB/MiP Is Eroding the SMD Display Application Market